

Defect density and defect leakage are the two formulas every metrics deck reaches for, and they measure different things. Defect density is defect count divided by size, conventionally thousands of lines of code (KLOC): Density = Defects / KLOC. Defect leakage is defects found after a given stage divided by total defects found, as a percentage: Leakage = (Defects Found After Stage / Total Defects Found) × 100. Both formulas are correct arithmetic. The KLOC denominator is the one that breaks.
If defect leakage and defect escape rate look like the same metric to you, you're right more often than not: they're near-synonyms in common usage, and our piece on defect escape rate already owns the harder argument, that a single escape number hides which of five stages should have caught the defect and didn't. This piece doesn't re-run that argument. It exists because before a leakage percentage can be segmented by stage, it needs a formula that isn't lying about its own denominator, and defect density has the same problem in a different place.
This is for the QA engineer or SDET who's been asked to name the formula, on a metrics deck, in an interview, or for an auditor who wants the arithmetic spelled out. It's not for the QA lead assembling a strategy document about where to spend a testing budget, that question belongs with test coverage metrics, and it's not for the team wondering whether an AI-generated suite is testing anything real, which is a QA metrics dashboard question; both are different questions with their own answers elsewhere. Give the formula, check the arithmetic, then argue about the one part of it nobody checks: the divisor.
The defect density formula, calculated
Defect density is a structural metric: defects divided by the size of what shipped, size almost always measured in KLOC, thousands of lines of code.
Defect Density = Total Defects / KLOC
The unit is defects per KLOC, and the number only means something once you also state which defects it counts (every severity, or one band) and which lines it counts (production code only, or production plus test code). The Software Engineering Institute at Carnegie Mellon built an entire framework around exactly this counting problem, because a KLOC figure means nothing until the counting rules behind it are stated. Both choices move the number without anything about the software changing.
Say a module ships as 8,000 lines of code, 8 KLOC, and testing finds 24 defects against it before release. Density is 24 divided by 8: 3 defects per KLOC. Report that figure without the KLOC number next to it and it's unfalsifiable. Report it with the KLOC number and anyone reading the deck can recompute it themselves.
Defect leakage, calculated
Defect leakage answers a different question: of everything your process eventually found, how much got past the stage that was supposed to catch it.
Defect Leakage = (Defects Found After Stage / Total Defects Found) × 100
The unit is a percentage, dimensionless by design, which is why it survives comparison across releases of very different sizes in a way density doesn't. Take a release where the full pipeline, unit through production, eventually turns up 50 defects total. Of those, 8 are found after the stage you're evaluating, say, after the team's internal sign-off. Leakage is 8 divided by 50, times 100: 16%.
That 16% is exactly the figure our defect escape rate piece treats in more depth, including the attribution trap that quietly reassigns which release gets blamed for an old defect, and the five-stage segmentation that turns one leakage percentage into a diagnosis of which gate actually failed. This article stays with the arithmetic and the denominator; that piece is where you go for the stage-by-stage read.
| Defect density | Defect leakage | |
|---|---|---|
| Formula | Defects / KLOC | Late defects / total found x 100 |
| Unit | Defects per KLOC | Percentage |
| Denominator | Code size, which a team can move | Total defects found |
| Worked example | 24 / 8 KLOC = 3 per KLOC | 8 of 50 = 16% |
| What it detects | Defect concentration vs code size | Share of defects caught late |
| Comparable across releases? | No, denominator moves | Yes, the ratio self-normalizes |
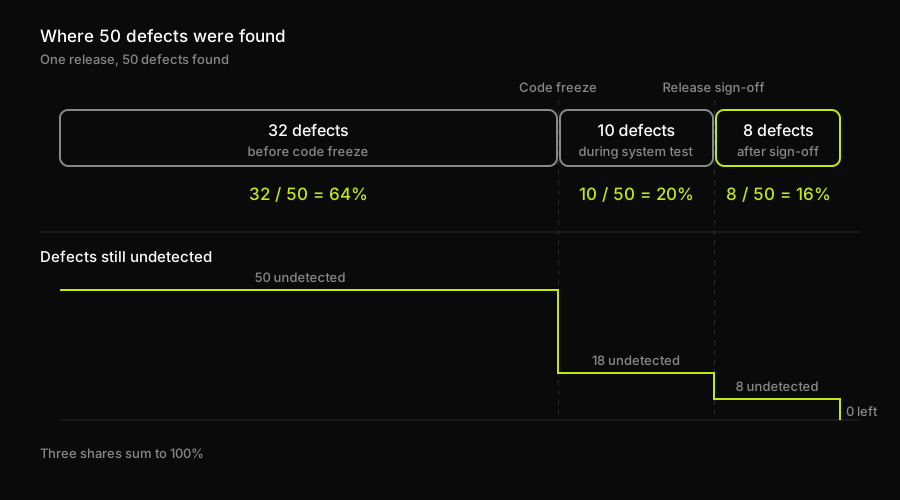
Every percentage divides by the same denominator, the 50 defects the release eventually turned up, which is why the three shares add to exactly 100%. Which stage should have caught each one is a separate question this arithmetic does not answer.
Why defects per KLOC breaks as a denominator
Defect density has one dangerous property: the denominator isn't fixed. It's lines of code, and lines of code are something a team controls directly, this sprint, without touching a single defect.
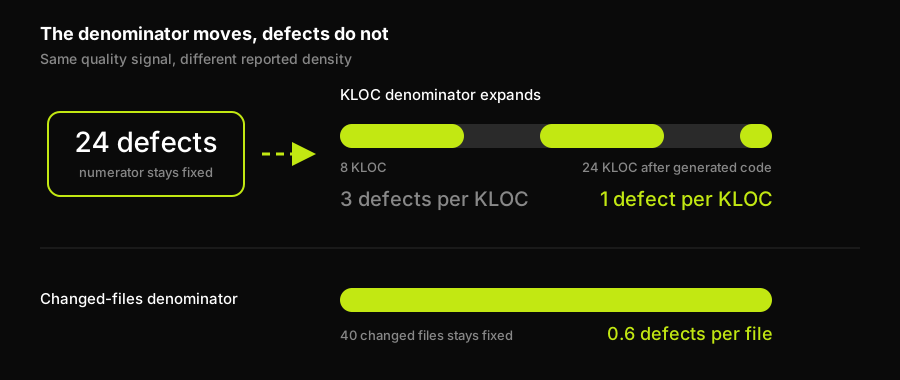
The KLOC bar expands while the defect count stays fixed. The changed-files denominator is shown separately because it does not move with generated boilerplate.
Go back to the density worked example: 24 defects against 8 KLOC, 3 defects per KLOC. Now suppose the same module's next release leans on a code-generation tool that triples the line count through boilerplate, generated types, and scaffolding a hand-written version wouldn't have needed. The module is now 24,000 lines, 24 KLOC. Testing still finds 24 defects: the same real defects, no more, no fewer. Density is now 24 divided by 24: 1 defect per KLOC. The metrics deck shows a threefold improvement. Nothing about the module's actual correctness changed. What changed is how many lines a generator chose to write on the way to the same behavior.
That isn't a hypothetical about careless teams. It's just what a ratio does once its denominator becomes a variable one side can move independently of the thing being measured. Any team, with or without a generation tool, can improve density by writing more code to do the same job: more layers, more indirection, more boilerplate. That's always been technically true. It only became decisive once a generator could move the denominator threefold in an afternoon without anyone deciding to.
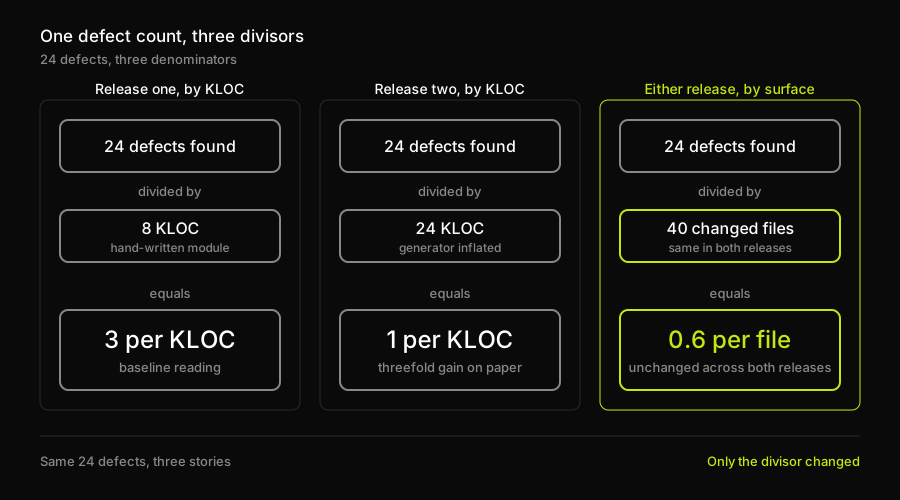
The numerator is identical in all three panels: 24 real defects, none of them fixed or introduced between readings. 24 divided by 8 is 3 and 24 divided by 24 is 1, so the only thing that moved the headline number by two-thirds is which divisor someone chose.
How Autonoma changes what the denominator should be
The KLOC problem above is a specific case of something metrics have lived with for decades: the technique for choosing what to measure was built when running a test, and writing a line of code, was the expensive part. Lines of code used to be a decent proxy for effort, and effort used to be scarce enough that measuring it made sense. Once writing code, and running tests against it, stops being the scarce resource, what's left worth keeping from the old metric is the part that says what a good denominator should be, not the part built to count what used to be expensive.
That's the problem our own architecture happens to route around, not because we set out to fix a metrics formula, but because of what we chose to make cheap. Autonoma plans and runs end-to-end tests directly against the running application, and a Diffs Agent re-plans the suite from the diff on every pull request rather than from the whole repository's line count. That architecture has a side effect worth naming here: it makes the changed surface, the diff a release actually touches, and the user-facing flow, the route or journey a test exercises, into things already being tracked for an entirely different reason. Neither one grows because a generator wrote more boilerplate somewhere else in the repository.
Put plainly: a system that plans and maintains tests from the diff and from the flows a user actually exercises already has the changed-surface and flow denominators sitting in its own bookkeeping, without ever needing the codebase's total line count to answer how much testing a release actually requires. That doesn't make it a defect-density tool, unit and structural density is still a job for your test runner's coverage report or a static analyzer, but it's yes-and, not a replacement: it gives the changed-surface and flow denominators something real to count against.
Denominators that survive
Three denominators hold up better than KLOC, because none of them can be inflated by writing more code that does the same job. This is also the part of the job that belongs to whoever fills in the metrics deck, not to the QA lead deciding which stage's testing budget to cut; that's a resource-allocation question with its own cluster of answers.
Defects per changed surface measures whether the parts of the codebase that actually moved this release are the parts producing defects. Measure it by taking the diff, the files or modules touched by the release's pull requests, as a fixed catalog, and dividing the defects that trace to those files by the count of files in that catalog. A release touching 30 files with 12 defects across them has a changed-surface density of 0.4 defects per file, unmoved if an unrelated part of the repository triples in size.
Defects per release measures trend over time with no size normalization at all, which is a feature, not an omission. Count total defects found per release, on a fixed cadence, the same per-release artifact a test closure report already exists to carry, and plot the raw number release over release. It can't be gamed by a denominator nobody's watching, because there isn't one.
Defects per user-facing flow measures defect concentration against what a user actually experiences: checkout, login, the export path. Enumerate the flows in scope, a fixed catalog independent of LOC, count defects tied to each, and divide by the number of flows tested. A release that tests 6 flows with defects concentrated in 1 tells you exactly where to look, which a repository-wide density number never could.
None of these three tells you why a defect happened, only how to compare counts fairly; for the cause, that's root cause analysis territory, not a denominator problem. For where a chosen denominator gets displayed and trended, test coverage metrics covers which coverage figures survive a strategy document, a QA metrics dashboard is usually where these get tracked release over release, and test automation metrics and release quality covers how they connect to release safety.
Density and leakage both survive as formulas; what breaks is treating a repository's line count as if it were still scarce. Report density against KLOC if a template demands it, but pair it with a denominator from the list above rather than letting it stand alone. Report leakage against a fixed taxonomy and window, and send the reader to defect escape rate the moment they ask which stage let something through, a different, more specific question than this one answers.
If your own leakage number keeps landing on the same behavioral row quarter after quarter, that's the layer Autonoma is built to test against directly: the end-to-end flows a generator's line count never touches.
Frequently Asked Questions
The defect density formula is defects divided by size: Density = Defects / KLOC. Defect density is a structural quality metric, the number of defects found divided by the size of what shipped, conventionally measured in KLOC, thousands of lines of code. The unit is defects per KLOC. It only means something specific once you state which defects it counts, all severities or one band, and which lines it counts, production code only or production plus test code, because both choices change the number without changing anything about the software.
Divide the number of defects found after a given stage by the total number of defects found across every stage, then multiply by 100 for a percentage. If a release's full pipeline eventually finds 50 defects and 8 of them turn up after the stage you're evaluating, leakage is 8 divided by 50, times 100, 16 percent. The stage you're measuring against and the window you're counting over both need to be fixed before you calculate, or the number can be moved after the fact.
There isn't a reliable cross-team benchmark, because defect density depends entirely on what you count as a defect, what you count as a line, and what kind of code you're measuring, choices that vary enough between teams, and even between modules on the same team, that comparing raw density figures across organizations tells you little. What's actually useful is tracking your own density on a stable denominator over time, and treating any density number reported without its denominator as unverifiable rather than informative.
In practice, very little. The two names are used for the same idea in most organizations: defects found after a stage divided by total defects found. The distinction worth keeping is that a raw leakage percentage is a single scalar, while a properly built escape rate breaks that scalar down by which of several stages should have caught each defect, which turns one number into a diagnosis. Our piece on defect escape rate covers that segmentation directly; this one covers the arithmetic and the denominator choices that either metric depends on.
Because its denominator, lines of code, is now something a team, or a code-generation tool, can change independently of the number of real defects in the software. Triple the line count through generated boilerplate while the real defect count holds steady, and density drops by two-thirds on paper without the software getting any more correct. A metric whose denominator can move without the thing it's measuring moving isn't tracking what it claims to track.
Autonoma does not prescribe one universal denominator, but it gives release teams useful evidence for choosing a denominator that reflects the user-facing surface. Its Planner and Diffs Agent analyze the codebase and PR changes to plan and maintain end-to-end coverage, while the Executor runs those checks in a live preview environment. That makes the changed surface and exercised flows concrete inputs to a release-level metric. For unit-level or structural density, pair that evidence with the appropriate unit-test or static-analysis data.


