

Defect escape rate measures how much of what your testing should have caught actually reached production: defects found in production divided by total defects found across all stages, over a defined window. Escape Rate = (Defects Found in Production) / (Total Defects Found) × 100. The number only means what it claims once you fix the attribution window and segment by the stage that should have caught each defect.
Somebody above you asked whether the testing investment worked. Not whether tests exist, whether they're catching anything. CI pass rates don't answer that: a green pipeline looks the same whether the suite does real work or just runs fast against nothing that matters. A single escape-rate figure has the same blind spot: something got through, not which of five stages should have stopped it.
This is for the QA lead, QA manager, or engineering manager who owns quality without a dedicated QA function, somewhere between Series A and Series C, with a real suite and a real release cadence already in place. It isn't for the team standing up its first tests, and it isn't for the team wondering whether its AI-generated suite is trustworthy at all; those questions have their own answers elsewhere. The trigger here is narrower: somebody upstream wants a number, and "the tests are green" isn't one.
Defect escape rate is that number. Most teams get the formula right and the attribution wrong, which quietly turns a testing-quality metric into a support-triage-speed metric. Fix the attribution and you still have a scalar; segment it by which of the five stages let the defect through and it becomes a diagnosis. Here's how to build the version that survives a leadership review.
The defect escape rate formula
Defect escape rate is the share of defects your process should have caught that a user, or a monitoring system, found instead of your test suite.
Escape Rate = (Defects Found in Production) / (Total Defects Found) × 100
Each term needs a precise definition, or the formula is decorative.
The numerator, defects found in production, counts any defect discovered after the code reached real users or a production-equivalent environment serving real traffic: a support ticket, an error-tracking alert, a monitoring threshold, a direct user report. It does not count a requested feature framed as a bug, a documented limitation, or a cosmetic nit nobody requested. Loosening that definition is one of the ways this metric gets gamed.
The denominator, total defects found, is every defect tied to the same release regardless of where it was caught: unit, integration, manual exploratory, E2E, and production combined. A defect is anything that deviates from specified or reasonably expected behavior in a way a user or downstream system could observe. If your team has a defect taxonomy from your entry and exit criteria, reuse it here.
The window is the reporting period: a release, a sprint, a quarter, fixed and stated, never a rolling "since we started tracking this." A cost of a production bug figure is a useful companion here: escape rate tells you how often testing missed something, that number tells you what it cost.
The attribution trap that makes naive escape rate lie
The formula above assumes a defect belongs to the release where it was found. It doesn't, it belongs to the release that introduced it, and those are often different releases entirely.
Say a defect ships in release 3, but nobody hits it until release 7. Attributed by where it surfaced, release 7's escape count rises while release 3 stays clean, even though release 3's testing is what missed it.
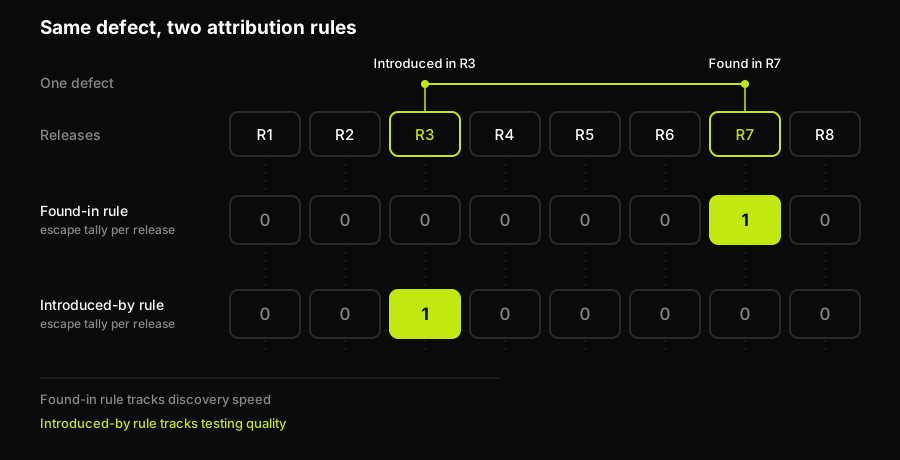
One defect, one timeline, two escape tallies. Under the found-in rule the escape is charged to release 7, which shipped nothing wrong; under the introduced-by rule it lands on release 3, whose testing is the thing that actually missed it.
This isn't a rounding error; it inverts what the metric measures. A naive found-in escape rate tracks discovery speed, not testing quality. A quarter where support triages faster, surfacing old bugs sooner, can show a worse escape rate than a quarter where testing quietly got sloppier and nothing has surfaced yet. Either way, leadership draws the wrong conclusion.
The fix has three parts. Attribute by introducing release wherever you can reconstruct it, from the commit that first shipped the defective code, not the one where the ticket got filed. Accept that your most recent releases will always look artificially clean, because their escapes haven't finished surfacing; that's incomplete data, not good news. And report on a lagging window, releases from roughly eight to twelve weeks back, so the releases compared have had equal time to accumulate their true escape count. Never compare a fresh release against a fully matured one; they answer different questions from different points on the same curve.
Segmenting by stage, the version that's actually useful
A single escape-rate number tells you something leaked, not where the gate failed, and that's the part a strategy review needs. Segment each escaped defect by the stage that should have caught it, and a scalar becomes a diagnosis.
| Escaped defect | Stage that should have caught it | What the gap indicates |
|---|---|---|
| Off-by-one error in pagination boundary | Unit | Logic gap, cheapest layer to catch |
| Null response crashes downstream service | Integration | Untested contract between services |
| Checkout freezes after applying promo code | E2E (behavioral) | Uncovered multi-step user flow |
| New users can't tell the app finished loading | Manual exploratory | No automated oracle, a judgment call |
| Feature flag missing from release config | Staging smoke check | Config drift, not code logic |
| Payment vendor changed a field with no notice | None could have | External dependency, not a test gap |
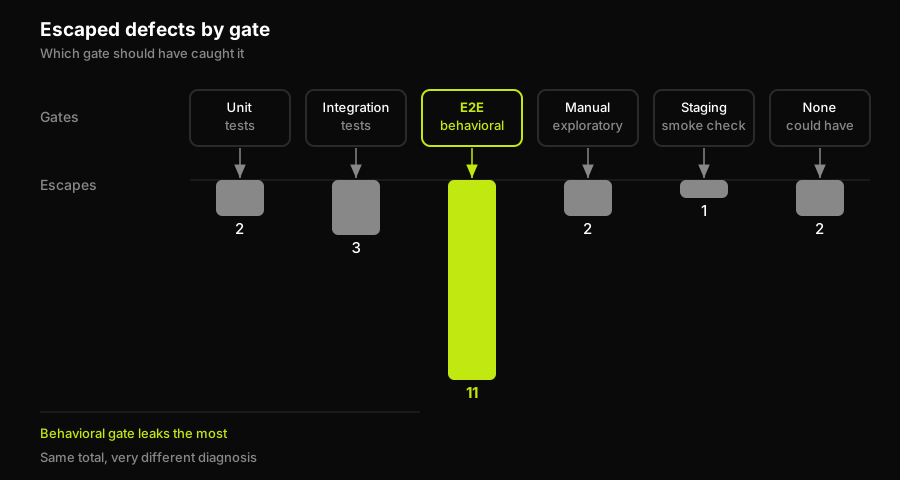
The same 21 escapes, sorted by the gate that should have caught each one. The behavioral row absorbs 11 of them while every other gate leaks in single digits, which turns one percentage into a specific place to spend the next quarter.
A 4% escape rate where every escaped defect is a null check is a different problem than a 4% escape rate where every escaped defect is a behavioral, multi-step flow. The first says your unit layer has a gap you can close in an afternoon. The second says your behavioral coverage isn't reaching the paths users take, a slower, costlier fix. Segmentation tells the two apart; the scalar on its own can't.
How Autonoma reduces escapes at the behavioral gate
On most teams that run this segmentation, one row refuses to go to zero: E2E, the behavioral row, and that isn't a coincidence. Behavioral coverage, tests that walk a multi-step user journey the way a customer would, is the most expensive kind to author by hand and the first to go stale when a flow changes, so it stays underfunded relative to how much revenue-critical surface runs through it.
That's the constraint we built Autonoma around. Our Planner agent reads the codebase directly, the routes, components, and flows connecting them, and plans the behavioral test cases a release needs, including generating the endpoints to set up the database for each scenario, so authoring stops starving the E2E row. Our Diffs Agent then runs on every PR, analyzing the diff to add, deprecate, and maintain tests as the flows change, so the gate doesn't quietly decay the way a hand-maintained E2E suite does.
Mapped against the table above, that's a specific claim, not a broad one: Autonoma addresses the E2E row. It has nothing to say about the unit row (your test runner's job), the integration row (a contract-testing or API framework), the manual exploratory row (a human judgment call by definition), the staging smoke check row (config drift, not code logic), or the row no gate could have caught (an external dependency changing under you). Autonoma is yes-and here, not vs.; it closes the behavioral gate without claiming the others.
Native mobile E2E, load/performance testing, and accessibility checks fall outside that scope and need their own dedicated tool.
Defect escape rate vs change failure rate
Defect escape rate and change failure rate get confused because both sound like "testing didn't work," but they count different things. Change failure rate counts deploys that caused a failure or needed remediation. Defect escape rate counts defects that got past a specific gate, whether or not it ever triggered an incident. A release can have a clean change failure rate and a rising escape rate at the same time for months, if the escapes it's accumulating haven't caused an outage.
The same reporting problem shows up in deployment frequency in a different shape: a raw count that looks great regardless of whether it reflects real throughput or just smaller commits. Deployment frequency and change failure rate are both part of DORA's software delivery performance metrics; defect escape rate is not, which is exactly why it can move independently of both. All three numbers are downstream of the same constraint, which the testing bottleneck behind the DORA metrics covers directly.
Reporting escape rate without gaming it
A metric that reflects badly on the person reporting it gets gamed, and escape rate is easy to game quietly. The common moves: reclassifying a production bug as a feature request or "expected behavior" after the fact, closing a ticket as "cannot reproduce" instead of logging it, attributing an escape to a legacy area nobody owns, and narrowing the definition of "production" until a production-like environment stops qualifying.
Three controls stop most of it. The classification decision, whether something counts as a defect and which stage should have caught it, cannot sit with the person the metric evaluates; a QA lead grading their own team's escape rate has an obvious conflict. The taxonomy of what counts as a defect and what counts as production has to be fixed before the window opens, not negotiated after a bad number comes in. And every reclassification gets logged with a reason and reviewed periodically, so the count can't shrink one exception at a time.
If you're deciding which other shift left testing metrics deserve a place in the document, test coverage metrics for a strategy document covers what survives contact with leadership and what's vanity. Where escape rate gets displayed for a recurring review is usually a QA metrics dashboard, not a slide rebuilt from scratch once a quarter.
That's the honest answer to the question a lot of shift-left guides raise and abandon: how do you prove to leadership that shifting testing left actually worked. DORA's research on test automation argues for moving inspection earlier in the pipeline, but the case for moving it is not the same artifact as evidence that you did. Not a single trend line, a defect escape rate built on introduced-by attribution, reported on a lagging window, and segmented by the gate that should have caught each escape. That's a number a QA lead can defend in a review, because it names which part of the pipeline earned the win and which part still owes one.
If your segmentation keeps landing on the same non-zero E2E row quarter after quarter, that's the gap Autonoma is built to close: the behavioral tests authoring capacity never had room for, generated from your codebase and kept current on every PR instead of drifting stale.
Frequently Asked Questions
Defect escape rate is the share of defects that reached production instead of being caught earlier in the pipeline: defects found in production divided by total defects found across every stage, over a defined reporting window. It's a testing-quality metric, not a raw defect count; a team that finds and fixes ten defects in QA and lets one reach production has a very different escape rate than a team that finds two and lets one reach production, even though both let exactly one through.
Divide defects found in production by total defects found across all stages for the same release, then multiply by 100 for a percentage. The two details that make or break the calculation: attribute each defect to the release that introduced it, not the release where it was discovered, and use a fixed taxonomy for what counts as a defect and what counts as production, decided before the reporting window opens rather than argued afterward.
There's no single benchmark that transfers across teams, because the number is only meaningful relative to your own denominator and your own taxonomy for what counts as a defect. What matters more than the absolute figure is the trend on a lagging window, using consistent attribution, and the segmentation by stage: a stable or improving escape rate with escapes concentrated in one identifiable gate is a healthier signal than an impressive-looking percentage reported under rules nobody wrote down.
Change failure rate counts deploys that caused a failure or needed remediation. Defect escape rate counts defects that got past a specific testing gate, whether or not that defect ever caused an incident. A release can have a clean change failure rate while its escape rate quietly rises for months, because the escapes it's accumulating haven't triggered an outage yet.
Defect escape rate, built on introduced-by attribution and reported on a lagging window, is the direct evidence: if shifting testing earlier actually worked, more of your defects are being caught at cheaper stages and fewer are reaching production, and the stage segmentation shows exactly which gate absorbed the improvement. A pass rate or a raw test count doesn't answer the question, because both can look perfect while nothing meaningful gets caught.
Only for the behavioral, E2E row of the segmentation table, not the whole metric. Autonoma's Planner and Diffs Agent generate and maintain end-to-end tests from your codebase, which closes the gap that's usually hardest to fund by hand: multi-step user flows that are expensive to author and quick to go stale. It has no effect on escapes that should have been caught by unit tests, API contract tests, a native mobile E2E tool, a load-testing tool, or an accessibility scanner; those rows need their own owner.


