

Change failure rate measures the percentage of production deployments that require unplanned remedial work, a hotfix, rollback, or emergency patch, out of all deployments in a given window. The formula is deployments that caused a failure divided by total deployments, times 100. Of the four DORA metrics, it's the one that reads test quality directly: a rising rate says the tests protecting your releases missed something that mattered, even while every one of them stayed green.
Ask five engineers at the same company for last quarter's change failure rate and you'll get five different numbers, and the gap isn't rounding error. It's definitional: whether a hotfix counts as the failure it responds to or as a deploy of its own, whether a bug reported on day six of a two-week window belongs to this release or the last one. Every one of those disagreements pushes the number down, never up, which is why the number leadership sees is usually flattering and usually wrong.
This isn't for the team still deciding whether to write tests, or the team wondering whether its AI-generated suite can be trusted; both have their own answers elsewhere. This is for the QA lead, QA manager, or engineering manager who owns quality without a dedicated QA function, Series A through Series C, with a real suite and a real cadence, who got asked for this number and needs it to mean something once it's written down.
How to calculate change failure rate (and what counts as a failure)
Start with the formula, because it hides the real argument inside one word. Change failure rate is the number of deployments that caused a production failure divided by total deployments in the window, times 100. The formula isn't the hard part. Deciding what counts as "caused a failure" is.
Four definitions compete for that word, and each produces a different number from the same deploy history.
A declared incident counts only deploys that triggered a formal incident, logged with a severity and an owner. Narrowest, easiest to report, since the classification work is already done, and the most flattering: plenty of breakage never gets formally declared. A checkout bug fixed in forty minutes by on-call often never becomes an "incident," even though it broke checkout for real users.
A rollback counts any deploy that got reverted, incident or not. Broader, but it misses failures patched forward instead of rolled back, which on a fast-CI team is most of them.
A hotfix counts any deploy that required an unplanned, out-of-cycle follow-up. Broader still, catching what rollback-only misses.
A customer-reported bug within N hours of deploy counts any deploy a real user hit closely enough in time to attribute, whether or not engineering formally responded. Broadest and noisiest, since attribution weakens as N grows.
Pick the broadest defensible definition: any deploy that required unplanned remedial work, incident, rollback, or hotfix. "Declared incident only" is the one every team gravitates toward, since it's easiest to pull from an existing dashboard, and the one most likely to make a real problem invisible.
Why reported change failure rate is too low
Two mechanisms push a self-reported number below the real one, in the same direction every time.
The first is the attribution window. A Tuesday deploy causes a failure nobody notices until Friday. Which deploy owns it? Same-day windows feel responsive but miss most delayed regressions; week-plus windows attribute more accurately but make the responsible deploy harder to isolate. A rolling three-to-seven-day window is the usual compromise. State it in the document; an unstated window is a silent judgment call made differently by whoever answers the question that week.
The second, and the more expensive one, is the hotfix attribution problem.
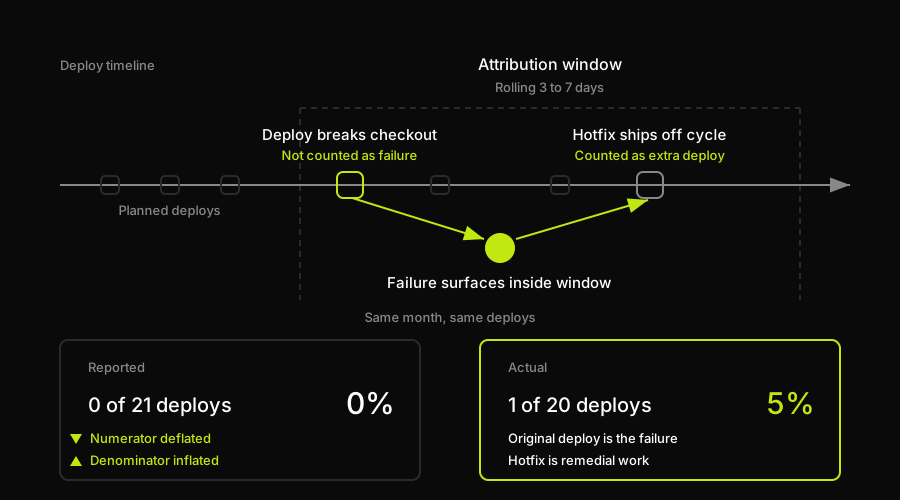
The hotfix miscount moves the number twice in the same direction: the deploy that broke checkout never enters the numerator, and the hotfix that repaired it inflates the denominator, reporting 0% where the real figure is 5%.
Say a team ships 20 planned deploys in a month. One breaks checkout. On-call ships a hotfix within the hour, off-cycle. If nobody files an incident for something fixed that fast, and the team uses "declared incident only," the original deploy never counts as a failure: numerator 0. The hotfix gets logged as its own deployment, so the denominator grows from 20 to 21. Reported rate: 0 divided by 21, or 0%. Using the broadest definition, the original deploy is the failure (numerator 1) and the hotfix is remedial work on it, not an independent deploy (denominator stays 20). Actual rate: 1 divided by 20, or 5%. Same month, same deploys. The entire gap between 0% and 5% is the hotfix miscount: numerator deflated, denominator inflated, at once.
| Event | Counts as a failure? | Common mistake |
|---|---|---|
| Declared incident | Yes | Treated as the only qualifying event |
| Rollback | Yes | Partial rollbacks go uncounted |
| Hotfix inside the window | Yes, against the original deploy | Logged as a new deploy, not a failure |
| Config-only revert | Yes | Dismissed as "not a real deploy" |
| Customer bug inside the window | Yes | Waiting on an internal ticket first |
| Deploy blocked before reaching users | No | Counted as though it shipped |
A seventh case: a planned follow-up release, shipping part two of a feature on schedule a week later, isn't a failure just because two deploys landed close together. The test is the same for all seven: did this deploy require unplanned work to fix something it broke? A scheduled part two didn't; a checkout bug patched at 2 a.m. did, incident report or not.
Green pipeline, rising change failure rate
Change failure rate is one of four DORA metrics; the case that all four trace back to one bottleneck, how long it takes to become confident a change is safe, is made in full elsewhere: DORA metrics and the testing bottleneck. Its sibling, deployment frequency, measures how often you ship at all. This one measures what happens on the ships you already made, and here's the diagnostic that makes it worth defending.
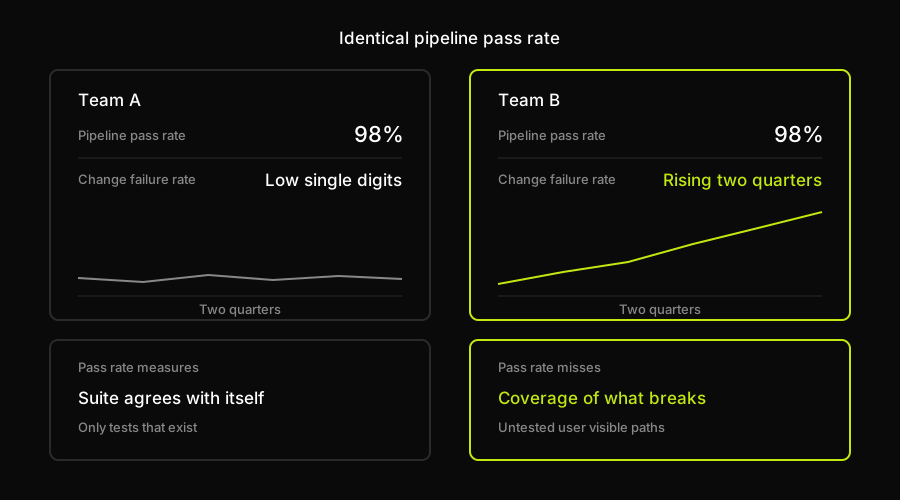
A 98% pass rate confirms the tests you already wrote still agree with each other. Only change failure rate tells you whether those were the tests that needed to exist for the surface currently changing.
Picture two teams, both passing 98% of the time on every PR. One's change failure rate holds steady in the low single digits; the other's has climbed for two quarters. The pipeline can't tell them apart: pass rate measures whether the suite agrees with itself, not whether it covers what breaks in production, the same blind spot that makes code coverage misleading for AI-generated tests.
A rising rate alongside a flat or improving pipeline is the clearest evidence that the suite stopped catching the class of thing that breaks production this quarter: a permissions edge case, a webhook payload shape, a state transition nobody scripted. Each shows up first as a production bug with a real cost; change failure rate is the earliest signal the pattern is recurring, not a one-off.
How Autonoma lowers change failure rate
Incidents, rollbacks, hotfixes, and customer-reported bugs all share a root cause once you strip away attribution: something changed, a user hit the consequence, and no test was asserting anything about that behavior at the time. Not that the team wasn't testing, most have real suites and real CI, but the specific user-visible path the change touched wasn't one anyone had gotten to writing a test for. Gaps like that are invisible on a pipeline dashboard, which only reports on tests that already exist.
That's the gap we built Autonoma to close. Connect a codebase, and our agents read the routes, components, and user flows to generate behavioral end-to-end tests from what the application actually does, not a list someone had time to write, including the endpoints needed to put the database in the right state for each scenario. Those tests run against a live preview environment, and each result gets classified as a real bug, an agent error, or a mismatch. The piece that matters most here is the Diffs Agent, running on every PR, adding tests for what changed, deprecating ones that no longer apply, and surfacing the diff between runs so a reviewer judges what changed instead of authoring a new test. That's the shift the metric argues for: the constraint moves from authoring time to review attention, which scales across a team in a way one or two people's authoring time never did.
None of this replaces the rest of your testing layer. A failure caused by a load spike, an API contract break, or a native mobile regression needs its own tool, not a claim that one platform covers everything. What Autonoma changes is the failure class covered here: the user-visible consequence of a change nobody wrote a test for.
Change failure rate vs defect escape rate
Change failure rate and defect escape rate get confused constantly because both sound like "testing didn't catch something," but they answer different questions with different denominators. Change failure rate counts deploys: what fraction of the changes you shipped caused unplanned work. Defect escape rate counts defects: what fraction of the bugs that exist made it past testing into production, regardless of how many deploys they're spread across.
A single deploy that ships three defects to production is one change failure and three escaped defects. A 5% change failure rate paired with a climbing escape rate is a different problem than a quarter where both move together: the first says failures are rare but severe, the second says the suite's overall catch rate is degrading. Report both and they check each other; report only one and you're describing half the picture.
Put change failure rate in your exit criteria section
A test strategy allocates a scarce resource. That resource used to be time to write tests. It's now attention to review them, and change failure rate tells you whether that attention is going to the right place: a rising rate on a green pipeline means the suite is being reviewed and maintained, just not on the surface that's actually breaking.
That makes it a gate, not just a report. Most exit criteria sections list a defect count and a pass rate and stop, leaving change failure rate as something reported after the fact rather than something that blocks a release. Wording that actually gates a release looks like this:
Fifteen percent is a starting point, not a standard, and it'll look alarming next to whatever narrower definition you used before. That's the point: a number that gates something has to measure the real thing, not the flattering one. This belongs in a document for a team with a real suite and a real cadence, not a team still deciding whether to write tests at all.
Write your definition down before the number does, since the version that survives a bad quarter is whichever one someone can point to in the document. Broadest definition, stated window, a real threshold: that's what turns change failure rate into a number that tells you something. If the gap between your reported number and your real one is a coverage gap, Autonoma is built to close it by generating the behavioral tests for what changed instead of waiting for someone to have time to write them.
Frequently Asked Questions
Change failure rate is the percentage of production deployments that require unplanned remedial work, a hotfix, a rollback, or an emergency patch, out of all deployments made in a given window. It's one of the four DORA metrics, and unlike the other three, it directly reflects whether the tests protecting a release caught the things that actually break in production.
Divide the number of deployments that caused a production failure by the total number of deployments in the same window, then multiply by 100. The formula is simple; the ambiguity is in what counts as a failure and which deploy owns it when the failure surfaces days after the deploy that caused it. Both decisions have to be stated explicitly, or the number isn't comparable from one reporting period to the next.
A good change failure rate is one that stays flat or improves against your own history, measured under a definition you have written down. Published industry benchmarks vary by report edition and by how narrowly each one defines a failure, which makes cross-team comparison mostly meaningless. A team that picks the broadest defensible definition, any deploy requiring unplanned remedial work, and tracks its own trend against its own history has a more useful number than one chasing an external percentile calculated under different rules.
Yes, but the failure belongs to the original deploy, not to the hotfix itself. The original deploy that required the hotfix counts as a failure under the broadest, most defensible definition, whether or not anyone filed a formal incident for it. The hotfix itself is remedial work responding to that failure, not an independent deploy that should inflate the denominator. Counting the hotfix as a new deploy while not counting the original deploy as a failure is the single most common way self-reported change failure rate ends up too low.
A change failure rate that's high or rising, especially alongside a pipeline that's staying green, means the test suite has stopped catching a class of thing that breaks production. The pipeline only reports on the tests that already exist; a high change failure rate is evidence that the wrong tests exist for the surface currently changing, not that testing overall has stopped happening.
Change failure rate counts deploys: the fraction of changes you shipped that caused unplanned work. Defect escape rate counts defects: the fraction of bugs that made it past testing into production, regardless of how many deploys they came from. A single deploy that ships three defects to production is one change failure and three escaped defects. A high change failure rate with a flat escape rate means failures are rare but severe when they happen; a flat change failure rate with a climbing escape rate means the suite's overall catch rate is degrading. The two numbers check each other, so a strategy document should report both rather than treating them as interchangeable.
Autonoma generates behavioral end-to-end tests directly from the application's routes, components, and user flows, and its Diffs Agent updates that suite on every PR so newly changed surfaces get test coverage without anyone having to notice the gap and author it by hand. That addresses the failure class behind most change failures: a change whose user-visible consequence nobody wrote a test for. It doesn't cover load-related failures, API contract breaks, or native mobile regressions, which need their own tools, so a change failure rate caused by those classes is outside what a behavioral E2E suite can catch.


