

Deployment frequency measures how often a team successfully releases code to production over a given period, not how often it merges, tags, or deploys to staging. It's one of the four DORA metrics, calculated as production deployments divided by the reporting window (day, week, or month). Reported alone, it's easy to inflate; reported with the common miscounts filtered out, it's a fairly precise readout of how fast your team can safely turn a change into a shipped release.
Somebody above you asked for a number. Maybe it's a board deck, an audit questionnaire, or a VP who read a DORA writeup and wants to know where the team sits. You pull the deploy log, and the count is either suspiciously high or suspiciously low, and nobody told you which timestamp to use or which events actually qualify as a deployment.
If that's the trigger, this one is for you: QA leads, QA managers, and engineering managers who own quality without a dedicated QA function, at a Series A through Series C company with a real test suite and a real release cadence already in place. This isn't the pre-seed article for a team with no tests yet, and it isn't the one asking whether your AI-generated tests are actually testing anything real. Those are legitimate questions with their own answers elsewhere. This one is about counting a number you already produce, correctly.
How to measure deployment frequency
Deployment frequency has one job: tell you how often a change reaches production. That constrains which events you're allowed to count, and which single timestamp marks each one.
The timestamp is deploy pipeline completion, not merge, and not tag. A pull request merging to main tells you a change is ready to ship. A git tag tells you someone decided to name a release. Neither one tells you the change is live. The event you want is the moment your deploy pipeline finishes successfully and traffic is routed to the new version, whatever your pipeline calls that step (release, rollout, promote). If your pipeline runs a canary or a staged rollout, use the point where the rollout is declared complete and serving full traffic, not the point where it starts.
What counts as a deployment: production, and only production. A staging deploy, a preview environment build, or an internal-only environment push is not a deployment for this metric, no matter how often your CI dashboard logs it under the same pipeline name. If your team deploys to staging fifteen times to get one production release out, your deployment frequency is one, not fifteen.
The reporting window matters more than the raw total. Deployment frequency is a rate, not a count. Report it as deployments per day, per week, or as a rolling average over a fixed window (commonly 30 days), never as a bare number with no denominator. "312 deployments" tells a reader nothing without knowing whether that happened over a week or a year.
Formula: deployment frequency = production deployments ÷ reporting window.
Worked example: a team ships 46 production deployments across a 30-day calendar month. Deployment frequency is 46 divided by 30, or roughly 1.5 deploys per day. If the same team wants a weekly figure to compare against a competitor's stated weekly cadence, that's 46 divided by (30/7), or about 10.7 per week. Same underlying data, two valid windows. Pick one, state it in the report, and don't switch windows between reporting periods just to make a chart look better.
One more scoping question worth deciding upfront: does a hotfix that goes straight to production without a corresponding merge to the main development branch still count? It should. The metric tracks changes reaching users, not your branching strategy, so an emergency patch deployed straight from a hotfix branch counts exactly the same as a deploy that went through the normal release train.
Worth naming while you're deciding what "good" looks like for your own team: the 2024 Accelerate State of DevOps Report still frames the fastest-shipping teams as deploying on demand, often multiple times a day. That report's own performance clusters are derived from that year's survey data and shift between editions, so treat the framing directionally, as a sense of what's possible, not as a fixed band to report against.
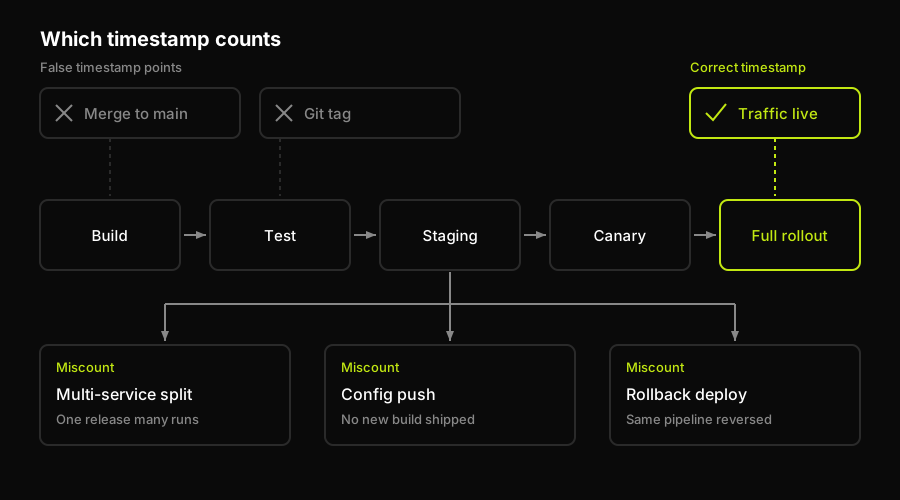
Count the moment the rollout finishes and traffic is live, not the moment someone merged or tagged.
The four miscounts
Once the timestamp and the scope are right, the next failure mode is what gets counted as one unit. Four patterns inflate deployment frequency in ways that are easy to introduce and hard to notice, because each one looks like a legitimate deploy event in the pipeline log.
| Miscount | Why it happens | Effect on the number | Fix |
|---|---|---|---|
| Multi-service inflation | One release, several service pipelines | One release counts as 3-12 deploys | Count by release, not by pipeline run |
| Config pushes | Flag and config changes reuse the deploy pipeline | Adds events that shipped no code | Only count runs deploying a new build |
| Rollbacks as deploys | Rollback triggers the same deploy pipeline | Inflates count, hides instability | Tag rollbacks separately, exclude from rate |
| Staging deploys | Dashboards log every environment in one feed | Massively overstates true frequency | Filter by environment: production only |
Each of these can be fixed independently, and none of them require new tooling, just a filter on the same deploy log you already have. The fix is almost always "count releases, not pipeline runs, and tag environment and rollback status on every run so the filter is a query, not a manual audit."
Why the number is capped, not chosen
Here's the part almost nobody selling a DORA dashboard says out loud: a team doesn't raise its deployment frequency by deciding to. Nobody sets a target of two deploys a day and gets there by simply choosing to ship more often. The number moves when something upstream of it moves, specifically, how long it takes anyone on the team to become confident that a given change is safe to release.
If it takes three days of manual QA to sign off on a change, the ceiling is one release every three days, no matter what the board deck asks for. Ship faster than that and the team isn't raising deployment frequency, it's skipping verification and calling it velocity. That's the same distinction that runs across all four DORA metrics at once; the causal argument across all four DORA metrics makes that case in full. The version specific to this metric is narrower: deployment frequency is a downstream read on how fast your test suite can produce confidence, not an independent lever a team pulls on its own.
That's the same shift a test strategy document has to account for. For years the scarce resource was time to write tests. Now it's attention to review them, and the review step is exactly what sits between "change is written" and "change is confidently shippable." Shrink that step and deployment frequency moves on its own. Try to move deployment frequency directly, without touching the review step, and the result is usually a lower bar, not a faster team.
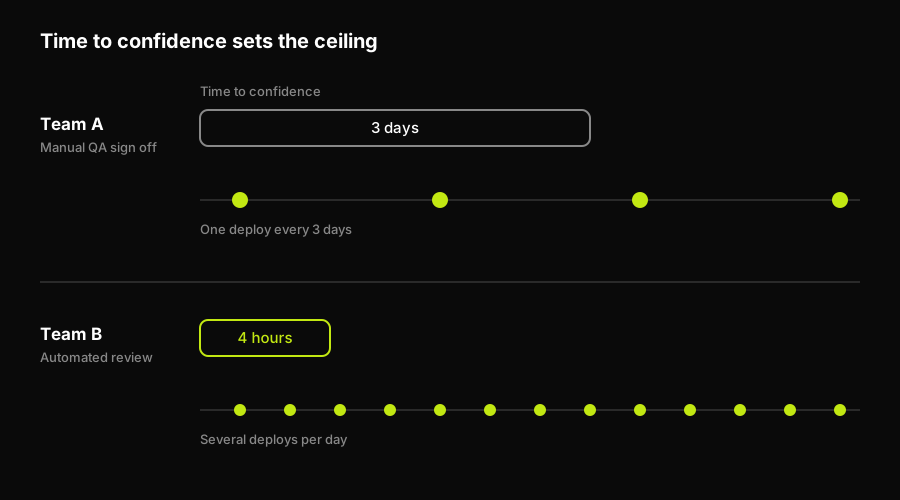
Deployment frequency is the output; time to confidence is the ceiling that sets it.
How Autonoma raises the confidence ceiling
We built Autonoma to sit exactly at that constraint. The problem this article documents, that a team's real deploy ceiling is time-to-confidence rather than a target number on a slide, is the same problem our agents were built to shrink.
Connect a repository, and our Planner agent reads the codebase (routes, components, user flows) and plans the end-to-end test cases a release actually needs, including the endpoints required to put the database in the right state for each scenario. Our Executor agent runs those tests against a live preview environment on every PR, and our Reviewer agent classifies what comes back: a real bug, an agent error, or a mismatch between the test and the current plan. When the code changes again, our Diffs Agent updates the suite from the diff, so tests stay aligned with the codebase instead of rotting into a maintenance backlog somebody has to triage before they'll trust a green run. None of that requires anyone to click through the app, record a flow, or hand-write a script; the codebase is the spec.
That's the confidence-ceiling move: if manual QA cycles, or a stale, half-trusted suite, are what's capping how fast anyone signs off on a release, shrinking that review step raises the ceiling on how often the team can safely deploy. It's worth saying plainly what this doesn't fix. Autonoma is the behavioral end-to-end layer; it doesn't replace unit tests, it isn't a load or performance testing tool, it doesn't do accessibility scanning or API contract testing, and it doesn't replace a QA hire's judgment on what a release actually needs. If the ceiling is a change-approval process, an infrastructure risk review, or an org chart that routes every release through one person's calendar, Autonoma doesn't touch any of that either. It only moves the part of the ceiling that testing time controls.
What to report alongside deployment frequency
Deployment frequency reported alone is gameable in both directions: ship trivial changes to inflate it, or batch everything into rare, careful releases to make each one look more deliberate than it is. Pair it with a stability metric so the reader can tell which failure mode, if either, is in play.
Change failure rate is the natural pairing: change failure rate is the percentage of production deployments that cause a failure requiring a fix or rollback, and a deployment frequency that climbs next to a climbing change failure rate means the ceiling didn't actually move, the team just started shipping past it.
If the audience for this report cares about production bug volume specifically rather than deploy-caused incidents, add defect escape rate as the second pairing.
And if this is going into a strategy document rather than a dashboard, the section that belongs right before deployment frequency is what you're actually testing and how much of it, which test coverage metrics covers as its own reporting decision.
Both of those measurement disciplines, timestamp source and denominator window, carry over cleanly from CI/CD testing and from what a zero-bug CI/CD pipeline actually requires: a pipeline that produces trustworthy signal is the same pipeline that produces a trustworthy deployment frequency number.
None of this is complicated once it's decided, but it's easy to skip if the number's only job is to fill one line on a template. A report that says "we deploy 12 times a week" answers the question that was assigned. A report that adds "measured as production releases only, from pipeline-completion timestamps, reported as a 30-day rolling average, alongside a 4% change failure rate" answers the question the reader actually had, which is whether the team ships fast without breaking things. That's the difference between a number and evidence.
Report deployment frequency as one number in a document and you've answered the question that was asked. Report it with the timestamp source named, the scope limited to production, the four miscounts filtered out, and a failure metric sitting next to it, and you've answered the question that should have been asked. If the number you produce this quarter is capped by test cycle time rather than by team discipline, that's worth saying in the document too, and worth fixing before the next one is due. Connect a codebase to Autonoma if reviewing a release, not writing the tests for it, is the actual bottleneck behind your number; that's the specific gap our agents were built to close.
Frequently Asked Questions
Deployment frequency is one of the four DORA metrics. It measures how often a team successfully releases a change to production over a given period, reported as a rate (per day, per week, or as a rolling average) rather than a raw count.
Count only production deployments, timestamped at deploy pipeline completion (when the rollout finishes and traffic is live), never at merge or tag time. Divide the count by a fixed reporting window: deployment frequency = production deployments ÷ reporting window. A team with 46 production deployments in a 30-day month is at roughly 1.5 per day.
It depends on release risk, architecture, and how the metric is scoped, so treat any fixed target with caution. The 2024 Accelerate State of DevOps Report still frames the fastest-shipping teams as deploying on demand, often multiple times a day, but that report's own performance clusters are derived from that year's survey data and shift between editions, so use the framing directionally rather than as a number to hit.
Not inherently. Across DORA's research, throughput and stability tend to move together for well-performing teams rather than trading off. If deployment frequency rises while change failure rate also climbs, that usually means verification is being skipped, not that frequency itself caused the problem. Report the two together to see which is happening.
Usually because the team is targeting the metric instead of its constraint. Deployment frequency is capped by how long it takes to become confident a change is safe to ship. Fixing the number means shrinking that verification cycle (faster or more trustworthy tests, faster review), not setting a deploy quota.
Autonoma doesn't set your deployment frequency, and no tool honestly can. What it does is remove one specific input to the ceiling: the time spent waiting on manual QA to verify a change is safe, by planning, running, and reviewing end-to-end tests against a live preview on every PR. If your ceiling is testing time, that ceiling moves. If your ceiling is approval process, org structure, or infrastructure risk, Autonoma doesn't touch those, and no honest answer would claim otherwise.


