

DORA metrics, meaning deployment frequency, lead time for changes, change failure rate, and time to restore service, all move on one shared constraint: how long it takes a team to become confident a change is safe to ship. Three of the four are downstream of that constraint, a constraint worth naming directly: time-to-confidence. Time to restore service is the honest exception, governed more by observability and rollback tooling than by test coverage. The causal chain runs metric by metric, and it explains why more CI parallelism speeds up a pipeline without changing what it proves.
A platform lead we talked to this year spent the better part of it on CI: bigger self-hosted runners, test sharding across more workers, a caching layer that cut build time in half. The pipeline got faster. The quarterly DORA review didn't move. Build time fell by more than half. Nobody in the room could point to a single line on the DORA chart that moved with it. Deployment frequency sat flat, change failure rate sat flat, and the slide leadership asked about was the one showing a year of infrastructure spend against a chart with no slope.
That's the piece for the person building that slide. Not another rundown of what the four metrics are; the vendor guides already have that covered and there's nothing new to say there. This is the argument: DORA metrics stay flat when the investment targets the wrong axis, and most CI investment targets pipeline duration when three of the four metrics are actually gated by something else entirely, while the fourth runs on its own clock, kept separate from that claim rather than folded into it.
This is written for QA leads, QA managers, and engineering managers who own quality without a dedicated QA function, somewhere between Series A and Series C, with a real suite and a real release cadence already in place. If you have no tests yet and are trying to justify writing your first one, that's a different problem with a different answer. If your worry is whether an AI-generated suite actually asserts anything real, that's also a different article. This one assumes a dashboard that's been flat for a quarter or two despite genuine tooling investment, and a leadership question that needs an answer better than "we're working on it."
The four metrics, in one line each
Deployment frequency counts how often you ship to production, and it's capped directly by how fast a team can convince itself a given change is safe (full measurement breakdown: deployment frequency).
Lead time for changes measures the stretch from commit to production, and once build and merge-queue time are tuned, the review-and-verify segment is usually its largest remaining term (see adding E2E tests to a CI/CD pipeline for where that segment actually lives).
Change failure rate tracks what share of deployments need a hotfix, rollback, or incident, and of the four it's the most direct read on what your suite actually checks (full measurement breakdown: change failure rate).
Time to restore service measures how fast you recover once something breaks, and it is the one partial exception, for reasons worth stating plainly.
The one constraint underneath
Time-to-confidence is the wall-clock interval between a change being ready for verification and the moment a human or a system can state, with evidence, that the change is safe to merge.
Start the clock the moment a PR opens or a push lands on a branch that triggers your test suite. Stop it the moment every required check has resolved green and any reviewer approval that depended on those checks has landed. That interval, not the full pipeline duration, is time-to-confidence, and it's measurable from timestamps most teams already log in their CI system and PR history.
Exclude three things or the number lies to you. Queue time waiting for a runner to free up is an infrastructure cost, not a confidence cost, and belongs in a capacity conversation, not this one. Jobs that don't gate the merge, a docs linter, an unrelated service's build, tell you nothing about whether this change is safe and should be dropped from the clock entirely. And the deploy step itself belongs to lead time for changes, not to time-to-confidence; conflating the two is the single most common measurement error we see.
What's left after those three exclusions is almost always test execution time, plus review time, plus whatever gets spent chasing a flaky failure that had nothing to do with the change under review.
Put a number on it and the exclusions matter immediately. A pipeline that takes eighteen minutes wall-clock might contain eleven minutes of actual test execution, four minutes of queued time waiting on a shared runner pool, and three minutes of an unrelated visual-regression job that doesn't gate this particular PR. Measuring the whole eighteen minutes as time-to-confidence blames the tests for a runner-capacity problem that has nothing to do with them. The real number is eleven minutes, and that's the one worth tracking on a dashboard over time, separately from pipeline duration.
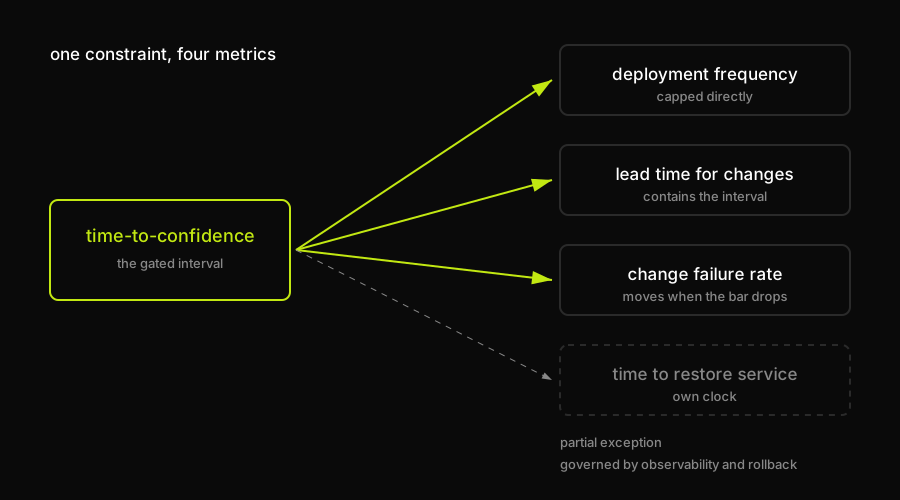
Three of the four metrics sit behind the same gate. Time to restore service runs on its own clock, governed by observability and rollback tooling rather than test coverage.
The chain, metric by metric
| DORA metric | Gated by time-to-confidence? | What actually moves it |
|---|---|---|
| Deployment frequency | Yes, directly capped | Shortening the verify interval |
| Lead time for changes | Yes, contains it as a term | Shrinking review-and-verify |
| Change failure rate | Yes, inversely | Verifying faster, not lowering the bar |
| Time to restore service | No, partial exception | Observability and rollback tooling |
Deployment frequency, one of the four metrics the 2025 DORA research report tracks, is capped by time-to-confidence directly. A team doesn't ship more often by deciding to ship more often; it ships more often once the interval between a change being ready and someone being able to prove it's safe shrinks enough that doing this daily stops feeling reckless. Every deployment-frequency initiative that skips straight to "deploy on every merge" without first shortening that interval just moves the anxiety downstream, onto whoever's on call. Two teams can run identical pipelines and still post different deployment frequencies for exactly this reason: the one with the shorter time-to-confidence ships more, not because its pipeline finishes faster in wall-clock terms, but because less of that wall-clock time is time nobody trusts yet. Coverage is what sets that interval's floor: a suite that can only speak to a fraction of the flows shipping this week leaves the rest to manual review, and that review time is the cap.
Lead time for changes contains time-to-confidence as a literal term in its own definition. Once build and merge-queue time are optimized, which most platform teams reach within a quarter of any serious CI investment, the review-and-verify segment is what's left, and for most teams with a real suite it is the largest remaining term in the whole measurement. That's the same segment defined above, and it's worth tracking on its own rather than folding it into an aggregate lead-time number that also contains queue time and deploy time you don't control the same way. Shorten it and lead time drops directly; leave it alone and no amount of build caching touches the number again.
Change failure rate is what happens when a team shortens time-to-confidence the wrong way: by lowering the bar for what counts as confident instead of by verifying faster. Quarantining a flaky suite instead of fixing it, skipping the E2E pass under deadline pressure, treating a green pipeline as sufficient when it only ever exercised a fraction of the flows shipping this week, all of these make the clock run faster while making the number it reports less true.
If change failure rate alone reads too coarse to tell you which specific gate is leaking, that's exactly what a stage-segmented view answers; see our piece on defect escape rate for the sharper version of the same signal. Both metrics ultimately feed the separate question of which numbers belong in a strategy document at all, which we cover elsewhere and won't re-argue here.
Time to restore service is the one metric in this set that mostly lives outside the argument, and saying so plainly is what keeps the rest of it honest. Recovering from an incident depends far more on how fast you can see what broke (observability, alerting, readable logs) and how fast you can undo it (feature flags, one-command rollback, a pipeline that runs backward as easily as forward) than on how much of the codebase has test coverage. A strong E2E suite might have caught the bug before it shipped, which is a change-failure-rate story, but once a bad change is already live, the tests already did what they were going to do.
This is the metric worth funding with better observability and better runbooks, not with more test coverage. Track it, invest in it, report it alongside the other three, just don't expect a testing initiative to move it.
How Autonoma shortens time to confidence
The chain above puts three of the four DORA metrics behind the same gate: how long it takes to trust a change. For most teams with a real suite already, that gate grows for a boring reason. Writing and maintaining E2E coverage competes directly with shipping features, so coverage lags behind the app, reviewers stop trusting what's there and start re-verifying by hand, or a team quietly narrows what the suite checks just to keep the number moving.
That's the specific constraint we built Autonoma to shorten. Connect a codebase and our agents read the routes, components, and user flows directly, then plan the test cases from the code itself, including the database state each scenario needs, instead of waiting for someone to write them by hand. Those cases run against a live preview environment on every pull request, and each result gets classified automatically: a real regression, an agent error, or a mismatch between the test and how the app actually behaves now, so a human reviewer isn't the one triaging noise before they can trust a green check.
Each of those steps carries its own verification layer rather than a single unchecked pass, which is what keeps the review-and-verify segment short without turning it into rubber-stamping: a reviewer is confirming a classified, evidenced result, not re-deriving it from scratch every time a check goes green. For the broader shape of what an agentic pipeline looks like end to end, see our piece on zero bugs in CI/CD.
A test strategy has always allocated a scarce resource. That resource used to be the time it took to write a test in the first place. It is now the attention it takes to review what an agent produced and decide whether to trust it, and that review step doesn't shrink just because generation got cheaper. Someone on the team still reads the plan, still approves the diff, still owns the call; what changes is how much of that reviewing a team can get through in a day, and that reviewing capacity is time-to-confidence.
Map that back to the chain and the effect is specific, not general. Deployment frequency moves because the review-and-verify segment shrinks without anyone cutting what gets checked. Change failure rate moves because verifying faster becomes the faster path, which removes the incentive to lower the bar instead. Time to restore service doesn't move, and it shouldn't. Autonoma has nothing to say about your alerting or your rollback story, and no testing product honestly does.
Why more CI parallelism doesn't help
Most of the CI/CD investment behind a flat DORA dashboard lands on one axis: how long the pipeline takes to run. More parallel runners, bigger self-hosted machines, smarter caching, test sharding across more workers. All of it is legitimate engineering, and all of it moves the same number: pipeline duration. None of it touches the other axis, which is what the pipeline actually proves once it finishes running.
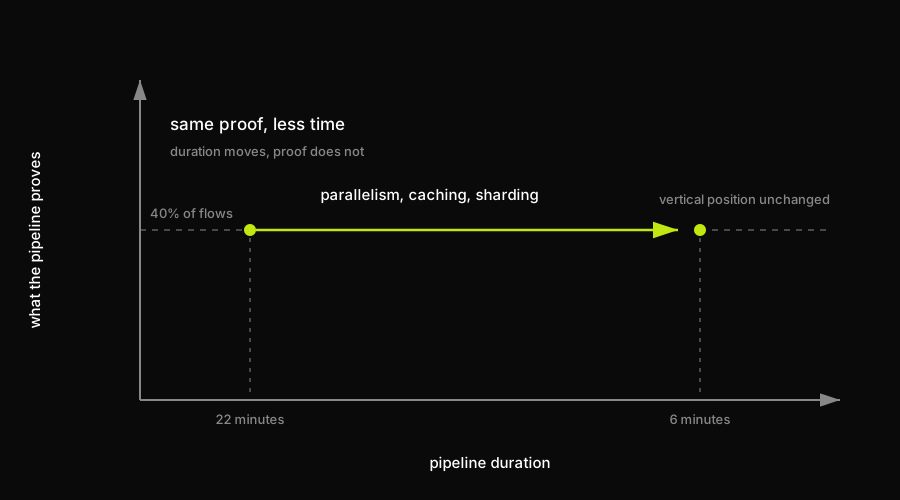
Parallelism, caching, and sharding move the point sideways. The vertical position, what the suite can actually prove, does not change.
A suite that checks 40% of your critical flows and finishes in six minutes proves exactly as much as it did at twenty-two minutes; you just find out the same amount, faster. If that suite was already the thing quietly capping your change failure rate, or the reason a team narrows scope under deadline pressure, spending a quarter of engineering time cutting the runtime in half changes nothing about the number leadership is watching. Confidence and speed are different quantities. One describes what you know. The other describes how fast you find out.
Flaky tests make this worse in a specific way. A team burns real CI budget re-running or quarantining flaky suites, six figures a year for a 50-person team by our count (see the full breakdown: flaky tests and CI cost), and quarantining a flaky test is textbook lowering the bar instead of verifying faster. It makes the pipeline faster and the number it reports less true in the same motion, which is exactly the change-failure-rate mechanism described above, just with a different trigger.
None of this is an argument against CI/CD investment, and it isn't a case for teams still deciding whether to write their first test either; that's a different problem with a different starting point. It's an argument for the QA lead or engineering manager already running a real suite, watching leadership ask why a year of tooling spend didn't move the chart. Faster pipelines are worth having on their own terms: tighter feedback loops, cheaper compute, a better day for the engineers waiting on a build. The mistake is expecting pipeline speed to move a dashboard that was never measuring speed in the first place.
Three of the four DORA metrics are downstream of how long it takes to trust a change, not how long the pipeline takes to run, and no amount of parallelism touches the trusting part.
If a team has already spent a year on the pipeline-duration axis and the numbers haven't moved, the other axis, what the pipeline actually proves, is where the next quarter of investment belongs. That's the axis Autonoma targets directly, and it's a reasonable place to start the next time leadership asks why the dashboard is still flat.
Frequently Asked Questions
DORA metrics are four measures from the DevOps Research and Assessment program used to gauge software delivery performance: deployment frequency, lead time for changes, change failure rate, and time to restore service. Three of the four move on a shared constraint, how long it takes a team to become confident a change is safe to ship, which is why they tend to stay flat together.
Most commonly because the CI investment behind the effort targeted pipeline duration (parallel runners, caching, more compute) rather than time-to-confidence, the interval between a change being ready for verification and someone being able to prove it's safe. A faster pipeline that still can't prove more about a change moves duration without moving the DORA numbers, because three of the four metrics are downstream of confidence, not speed.
Change failure rate is the most direct read: it tracks what fraction of deployments cause an incident, hotfix, or rollback, which is exactly what a test suite exists to prevent. Defect escape rate, segmented by pipeline stage, gives a sharper version of the same signal by showing which specific gate is leaking rather than just that something leaked.
Only indirectly, and only one of them cleanly. Deployment frequency and lead time for changes measure delivery speed, not quality. Change failure rate is the closest thing to a quality signal DORA offers, and even it measures the consequence of a quality gap (an incident happened) rather than quality itself. Time to restore service measures recovery speed, which depends on observability and rollback tooling more than on testing.
Test coverage sets a ceiling on how fast a team can become confident a change is safe, and deployment frequency is capped directly by that confidence interval. Thin or untrusted coverage means either a longer manual review to compensate or a lower bar for what counts as safe enough to ship, and both cap how often a team can deploy regardless of how the pipeline itself is tuned.
Autonoma targets the axis that actually moves three of the four DORA metrics: what a pipeline can prove about a change, not how fast the pipeline runs. Our agents generate and maintain end-to-end test coverage directly from the codebase and keep it current on every pull request, which shortens the review-and-verify segment of lead time without lowering the bar for what counts as safe. It has nothing to add to time to restore service; that metric depends on observability and rollback tooling, and we say so plainly rather than stretch the pitch to cover it.


