

Open source performance testing tools simulate concurrent users against an API or user flow so you can find the point where response times slip or requests start failing, without paying for a hosted load-testing platform. The four worth knowing are k6 (JavaScript, script-first, thread-light), JMeter (Java, GUI-first, widest protocol reach including JDBC and JMS), Gatling (Scala, Java, or Kotlin, async virtual users, HTML reports by default), and Locust (Python, gevent-based, code-first scenarios). The best open source load testing tool for your team depends less on raw throughput and more on who has to read the script six months from now.
Every roundup for this topic reads the same. A paragraph defining the category, then a wall of one-line blurbs: k6 is fast, JMeter is mature, Gatling is elegant, Locust is Pythonic. Nobody in that list has actually run a load test against a real endpoint and shown you what came out the other end.
Picture the team this is for: nine engineers, no dedicated performance engineer, shipping every week. Black Friday is six weeks out and nobody knows whether the checkout endpoint holds at 200 concurrent users or falls over at 60. That question has a specific, mechanical answer, and getting it doesn't require a platform subscription or a consultant, just one of four open source tools, maybe thirty lines of code, and reading the output correctly.
That's what follows: not another naming exercise, but a working comparison plus a script you can run in the next five minutes. (If the open question for your team is whether performance testing belongs in the pipeline at all rather than which tool to pick, that argument lives in our guide on where performance testing fits in a test strategy.)
k6 vs JMeter vs Gatling vs Locust: the five axes that matter
Five axes decide whether a load-testing tool survives past the first sprint you use it in: who can write the script, which protocols it reaches, how much hardware one virtual user costs, how it behaves inside a CI pipeline, and what you get to look at when it's done.
| Tool | Script language | Protocols | Cost per VU | CI gating |
|---|---|---|---|---|
| k6 | JavaScript | HTTP, gRPC, WebSocket | Goroutine, low memory | Native, non-zero exit on threshold |
| JMeter | Java, XML plans | HTTP, JDBC, JMS, LDAP, FTP, TCP | Thread per VU, heavier | Third-party plugin required |
| Gatling | Scala, Java, Kotlin, JS | HTTP, WebSocket, gRPC, JMS, MQTT | Async message, not thread | Native GitHub Actions, GitLab, Jenkins |
| Locust | Python | HTTP, custom clients | Gevent greenlet, light | Native, non-zero exit headless |
The table can't show what happens when a threshold fails inside a pipeline, and that's usually the axis that actually decides the pick. k6 fails a build like a linter would: define p(95)<500 in the script, and k6 exits non-zero the moment it's breached. Locust does the same through a headless run, exiting non-zero by default whenever a sample fails. JMeter needs a third-party Maven, Gradle, or Jenkins plugin to turn a results file into a build failure, which its own site confirms is supported, just not native. Gatling ships its own CI/CD integrations for GitHub Actions, GitLab, Jenkins, and Azure DevOps.
Protocol breadth breaks the tie for anyone testing something that isn't a REST API. If the system under test is a message queue, a raw TCP socket, or a database connection pool, three of these four tools simply don't reach it. Only JMeter's protocol list covers JDBC, JMS, LDAP, FTP, SMTP, and native TCP out of the box. k6's HTTP client also turns up in roundups of API testing tools for its assertion syntax, but that's a different job than the one it's doing here, which is purely about how many virtual users one process can sustain, not functional correctness of a single request. Reporting is the fifth axis and the one with the widest spread: Gatling writes a full HTML report on every run without configuration, JMeter renders results through listeners you add to the plan, and k6 and Locust both default to a terminal summary you either read in the pipeline log or ship to an external dashboard.
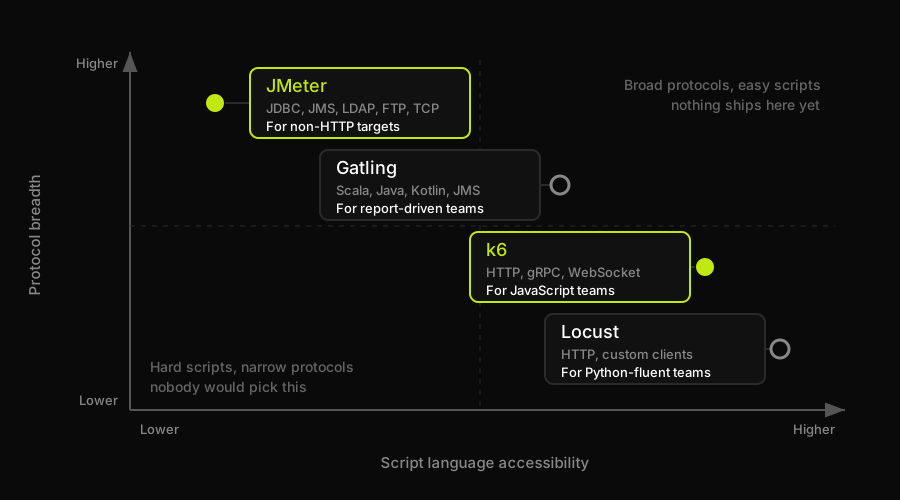
The two axes pull against each other: JMeter buys the widest protocol reach with XML test plans nobody enjoys editing, while k6 and Locust buy readable scripts by covering less. Gatling is the only tool that refuses to sit at an extreme, and the top-right quadrant, broad protocols with easy scripts, is empty for a reason.
A runnable k6 load test script
k6 is the pick for the team in the hook: a JS-fluent group testing an HTTP checkout flow who wants a build-breaking threshold, not a GUI to babysit. Install it, and you're one script away from an answer.
On macOS, that's brew install k6. Linux and Windows install paths are on k6's own installation docs.
Here's the script: a staged ramp from 0 to 200 virtual users against a checkout endpoint, with a threshold that fails the build if the 95th percentile crosses 500ms or more than 1% of requests error.
Run it with k6 run checkout-load-test.js. No separate test runner, no extra build step. The options block inside the script already defines the stages and the thresholds, so the same file that describes the test also decides whether it passed.
The terminal output at the end is where the actual decision gets made, and it's worth knowing what each line means before Black Friday, not during it. vus is the current number of active virtual users, so you can confirm the ramp actually reached 200 rather than stalling at 40 because of a connection limit somewhere upstream. iterations is the aggregate count of times a virtual user ran the whole default function, which is your throughput number: divide by test duration and you get a rough requests-per-second figure for the full flow, not just one request.
http_req_duration is the total time per request; k6's own metrics reference breaks it into sending, waiting, and receiving time. The number that matters most is its percentile breakdown: p(95) is the response time that 95% of requests beat and 5% didn't. Averages hide the tail; p(95) doesn't. http_req_failed is the failure rate, the share of requests that didn't come back with a successful status. The threshold line at the bottom, a checkmark or an X, is the verdict: if p(95)<500 shows an X, k6 exits non-zero, the signal your CI pipeline is watching for.
The breach that actually matters is rarely the average. A checkout flow that averages 180ms with a p(95) of 4 seconds means one in twenty customers is staring at a spinner during checkout, and an average will never show you that customer.
The JMeter tradeoff
JMeter gets filed under "legacy" in almost every comparison on this topic, and that's the wrong framing for a specific, common case. If what you're load testing is a message queue, a database connection pool, an LDAP directory, or a mail server, JMeter isn't the fallback option. It's the only one of these four tools that reaches it at all: its protocol list runs through JDBC, JMS, LDAP, FTP, SMTP, POP3, IMAP, native TCP, and raw Java objects, on top of HTTP.
The cost is real, and it's not about age. JMeter test plans are .jmx files, and building one in the GUI (which is how its own documentation still walks you through it) produces a verbose file that diffs badly in git: a one-line header change can rewrite a large chunk of the structure. JMeter's own guidance is explicit that heavy listeners like View Results Tree exist for scripting, not execution, and that real load runs belong in CLI mode, not the GUI you built the plan in.
None of that makes JMeter the wrong choice for a JDBC load test. It makes it a tool whose maintenance cost you pay upfront, in exchange for protocol coverage nothing else on this list has.
How Autonoma complements a load testing setup
Everything above answers one question: does the system survive volume? None of it answers a second, quieter question: is the feature still correct while it's under that volume? A load test that returns HTTP 200 on every request to a checkout endpoint still passes even if the discount code silently stopped applying at VU 150. Nothing in k6, JMeter, Gatling, or Locust's assertion model is built to catch that, because none of them test functional correctness in the first place.
That's the gap Autonoma sits in, not on top of. It reads a codebase and generates end-to-end tests for the actual user flows, checkout included, then runs them against a live preview and has a reviewer agent separate real regressions from noise. Think of it as a separate CI stage answering a separate question: functional correctness at one user, where the four tools above answer throughput at two hundred. Run them side by side and each gate fails for a reason the other one is blind to.
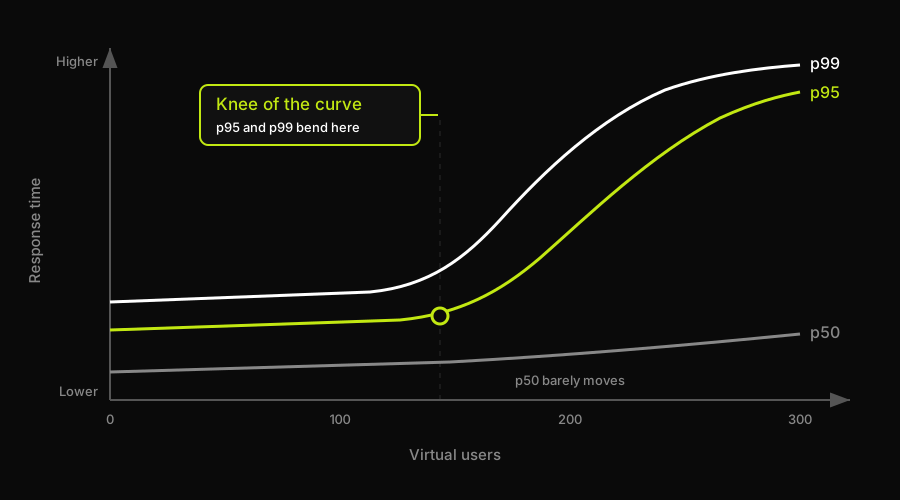
The knee is where the answer lives. Past it, p95 and p99 climb steeply while p50 keeps drifting along almost unchanged, which is exactly why a checkout flow can average 180ms and still leave one customer in twenty watching a spinner.
Where open source load testing runs out
Open source covers the case in the hook comfortably: one team, one checkout flow, load generated from a laptop or a single CI runner. It stops covering the case a few steps further out, and the thresholds are specific enough to name.
Distributed geographic load generation is the first one. If the requirement is simulating real users from five continents to catch a CDN misconfiguration or a regional latency spike, a single k6 or Locust process running out of one CI runner's data center can't produce that traffic pattern, no matter how many virtual users it spins up locally.
Very high VU counts are the second. Grafana's own comparison of the two architectures notes that a single k6 process can push into the tens of thousands of VUs on strong hardware, goroutines being far cheaper than JMeter's threads, while a JMeter run tends to top out around a thousand VUs per box before you need a second machine. Past whatever ceiling your own hardware actually has (worth measuring, not assuming), you're provisioning and coordinating a cluster of load generators yourself, which is exactly the operational work a managed load-testing service exists to remove.
Long soak tests are the third. A 48-hour run looking for a slow memory leak needs infrastructure nobody wants to babysit over a weekend: something has to keep the load generator alive, capture results if it crashes at hour 30, and page someone if it does. That's ops work, not scripting work, and it's a legitimate reason to reach for a managed platform, or a tool built for exactly that kind of unattended run from our open source test automation roundup, instead of self-hosting the same open source tool at a bigger scale.
There's a rough tell for when you've crossed into that territory: if provisioning and babysitting the load generators is eating more of the sprint than writing and reading the test itself, the calculus has already flipped. At that point the fully loaded cost of a few unattended nights on a managed service is usually lower than the engineering hours spent building and maintaining your own distributed harness, and the open source tool underneath doesn't change; k6 and Gatling both show up inside commercial platforms, just orchestrated at a scale a laptop or a single CI runner was never meant to reach.
Which open source performance testing tool should you pick?
Pick k6 if your team already writes JavaScript and the target is HTTP, gRPC, or WebSocket: it's the fastest path from zero to a build-breaking threshold. Pick JMeter without apology if you're hitting JDBC, JMS, or anything else on that protocol list, and budget real time for maintaining the test plan. Gatling earns its place when the deliverable is a report a non-engineer has to read, and its message-based virtual users make it a reasonable second look even on the HTTP path k6 already covers. Locust wins when the team's fluency is Python and the target needs a client library nobody else ships.
None of the four tells you whether the feature under load is still correct, and that's fine, they were never built to. That's where Autonoma picks up: functional coverage for the same flows, running as its own CI stage next to whichever load tool you chose above. Track how your test plans and results are organized too; test management tooling becomes the harder problem once more than one person is writing load scripts, and visual regression coverage is worth adding once you're confident the backend holds under load and want the front end held to the same standard.
Frequently Asked Questions
There isn't a single best one, the right pick depends on protocol and team fluency. k6 is the fastest path to a CI-gated load test if your team already writes JavaScript and the target is HTTP, gRPC, or WebSocket. JMeter is the right answer if you're testing JDBC, JMS, LDAP, or another non-HTTP protocol it covers. Gatling suits teams that need a polished HTML report by default, and Locust suits teams more comfortable in Python than JavaScript or Scala.
Yes. The k6 CLI and its JavaScript scripting engine are open source and free to run locally or in your own CI pipeline. Grafana also sells a hosted version that adds distributed load generation and result storage, but the core tool covered in this comparison costs nothing.
Use k6 if your team writes JavaScript and you're testing HTTP, gRPC, or WebSocket, since its goroutine-based virtual users are lighter on memory than JMeter's thread-per-VU model and its scripts double as version-controlled code. Use JMeter if you need to load test JDBC, JMS, LDAP, FTP, or another protocol outside that list, since it's the only one of the two with native support for them. Plenty of teams run both, k6 for the HTTP surface and JMeter for the systems behind it.
Yes, all four tools support it. k6 and Locust both exit with a non-zero code when a defined threshold or failure condition is breached, which is enough to fail a build directly. JMeter needs a third-party Maven, Gradle, or Jenkins plugin to translate its results file into a pass or fail signal. Gatling ships native integrations for GitHub Actions, GitLab CI, Jenkins, Azure DevOps, and more.
Not for the common case: one team validating one flow from one region, generated from a laptop or a CI runner. A paid service starts to earn its cost once you need distributed geographic load generation, VU counts beyond what your own hardware can produce, or long unattended soak tests where someone needs to be paged if the load generator itself falls over.
A second gate that fails for a different reason. All four tools above measure the system under volume: throughput, latency, and the point where it degrades. None of them check whether the checkout flow still works correctly for a single user, and a load script pointed at an endpoint will happily keep passing after the feature above it broke. Autonoma covers that side. It reads your codebase, generates end-to-end tests for the flows that actually exist in it, runs them against a live preview environment on every pull request, and a Reviewer agent classifies each failure as a real bug, a test mismatch, or an agent error instead of handing you a red build to sort out by hand. It generates no virtual users and measures no throughput, so it substitutes for none of the four. The pairing is the useful part: an open source load tool owns the performance axis, Autonoma owns the functional one, and a threshold breach and a broken flow stop looking like the same alert.


