

Automated test reporting means your CI pipeline generates a structured report (JUnit XML, Allure, or HTML) on every run, publishes it as a build artifact, and routes the result to a PR comment, a Slack channel, or a dashboard without anyone manually collecting screenshots or pasting pass/fail counts into a doc. Wiring it in takes three pieces: a reporter plugin configured in your test runner, an artifact-upload step in your CI job, and a routing step that posts the parsed result somewhere a human will actually see it.
There is a version of this story at every company that ships software. A release is two hours out. Someone, usually the most senior QA person in the room, is manually screenshotting a test runner's console output, pasting failure counts into a spreadsheet, and messaging a summary to a channel by hand. Nobody assigned this. It became a job because nobody automated it, and by the time it mattered enough to fix, it was easier to just do it the night before.
That job should not exist. A CI pipeline already runs the tests. The only missing piece is telling it what to do with the results afterward: package them, store them, and put them in front of someone. That is the entire scope of automated test reporting, and it is a smaller lift than most teams assume.
What automated test reporting means
Automated test reporting is the practice of having your CI pipeline produce a structured, machine-readable summary of a test run and distribute it without human intervention. Three things have to happen for a "report" to actually count as automated: the test runner emits a standard format (not a wall of console text), that format gets stored as a build artifact so it survives after the job finishes, and something reads that artifact and pushes it to a destination a person will see.
Skip any one of those and you are back to manual work. A test runner that only prints to stdout gives you a log, not a report; someone still has to read the log and translate it into a decision. An artifact that is generated but never uploaded disappears when the CI runner is torn down. A report that is uploaded but never routed anywhere sits in a build history nobody opens until something has already gone wrong in production.
The report itself is not the hard part. Most test runners, whether that is Jest, pytest, Playwright, or a JVM stack, ship a reporter for at least one standard format out of the box. The hard part, and the part this article covers, is wiring the three pieces together so the report shows up somewhere useful within seconds of the build finishing.
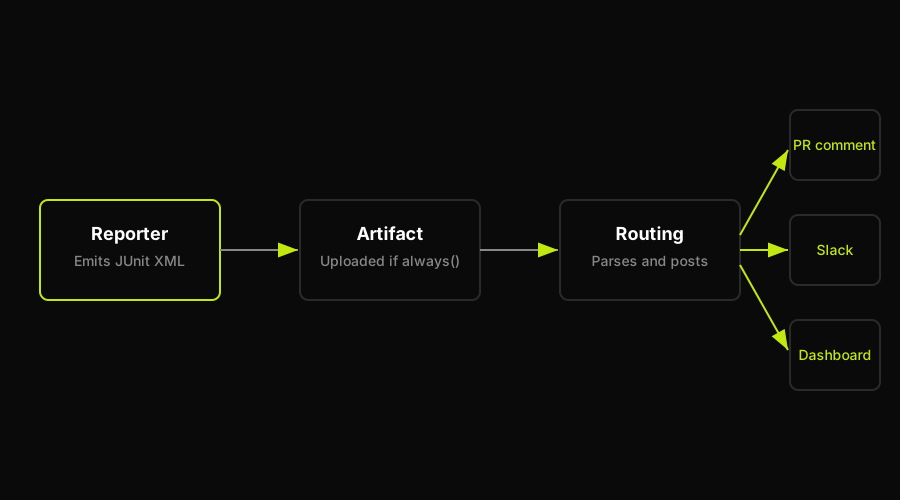
The reporter emits a standard format, the artifact upload preserves it past the job, and the routing step fans the same result out to every audience.
Wiring a reporter into CI
Start with the reporter format. JUnit XML is the closest thing testing has to a universal interchange format: nearly every CI platform, dashboard, and PR-comment action knows how to parse it, even if the test runner that produced it has nothing to do with Java. Allure produces a richer report with step-by-step breakdowns and history trends, at the cost of needing a separate generation step to turn its raw results into a viewable report. A framework's native HTML reporter (Playwright's is a common example) is the fastest to look at directly but the hardest to pipe into other tools, since it is built to be opened in a browser, not parsed by another program.
| Format | Best for | Tooling support | Trend history |
|---|---|---|---|
| JUnit XML | PR comments, dashboards | Near universal | No (needs external storage) |
| Allure | Rich failure detail | Wide, needs generation step | Yes, built in |
| HTML (native) | Quick human review | Narrow, framework-specific | No |
Most teams should default to JUnit XML as the primary artifact, even if they also generate Allure for deeper debugging, because it is the format every downstream integration (Slack actions, PR-comment actions, most dashboards) expects first.
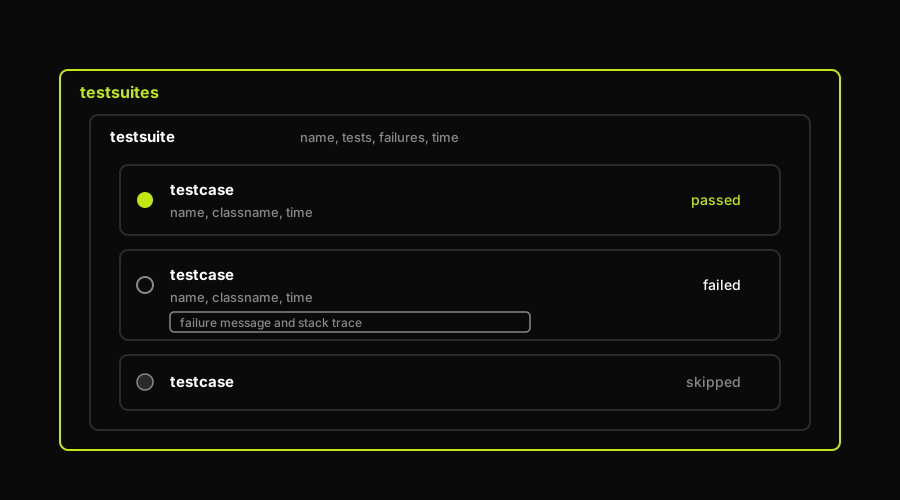
JUnit XML nests test cases inside suites, recording status, timing, and failure details in a structure nearly every tool can parse.
Once the test runner is configured to emit that format, the CI job needs two more things regardless of platform. Upload the report file as a build artifact, so it persists past the job and can be handed to another step. Run that upload step with an always-run condition, not a success-only condition. This is the mistake that quietly breaks reporting pipelines: if the artifact-upload step only fires when the test step passes, you get reports for green builds and silence for red ones, which is backward. The failures are exactly the reports you need most.
Here is what that looks like as a GitHub Actions job. The test step writes its output to a results directory (commonly something like test-results/junit.xml). The next step is an artifact-upload action pointed at that path, set to run with if: always() so it fires whether the previous step passed or failed. A third step, also set to run unconditionally, reads that same file and hands it to whatever is doing the routing, whether that is a dedicated PR-comment action, a Slack webhook step, or a small script that posts a summary. The pattern holds on GitLab CI, CircleCI, and Jenkins too: a test step that writes a known-format file, an artifact step with an unconditional run policy, and a routing step that reads the same path.
For a comparison of dedicated reporting tools, including which ones handle the generation and hosting side for you, test reporting tools walks through the current options.
Routing reports: PR comments, Slack, dashboards
Once the artifact exists, routing is a matter of picking where the result needs to land and how fast someone needs to see it. A PR comment is the right destination when the audience is "whoever opened this PR," and the value is catching a regression before it merges. Most CI platforms have an action or plugin that reads a JUnit file and posts a formatted comment with pass and fail counts directly on the PR, which keeps the feedback loop inside the same screen the engineer is already looking at.
Slack is the right destination when the audience is the team, not an individual, and the failure needs eyes fast: a broken main branch, a nightly regression suite that failed, a release-gate check that did not pass. Posting to Slack from CI is usually a webhook call at the end of the job, triggered on failure (or always, if the team wants green confirmations too), with the message built from the same parsed JUnit or Allure output used for the PR comment. The content should stay short: pass and fail counts, a link to the full report artifact, and the names of the tests that failed. A wall of stack traces in a Slack channel gets ignored by the second occurrence.
A dashboard is the right destination when the audience needs trends, not a single run: is the fail rate climbing, is one suite consistently slower than the rest, is a particular test flaking on a schedule. Turning raw CI runs into a queryable trend line covers what to track once you get past single-run alerts, and building a test results dashboard walks through turning a pile of raw runs into one readable signal.
Most mature setups run all three simultaneously: PR comments for per-change feedback, Slack for team-wide failure alerts, a dashboard for trend visibility. Different audiences reading the same underlying artifact at different latencies.
How Autonoma keeps automated reports honest
Everything above assumes the report is trustworthy: that a red result means the application actually broke, and a green result means it actually works. That assumption erodes over time in every test suite that is not actively maintained. A locator shifts when a component gets restyled. An API response shape changes and a fixture goes stale. None of that is a real regression, but it produces a failing test, and a failing test produces a red report, and the report you just automated dutifully delivers that false signal to the PR, the Slack channel, and the dashboard with the same confidence it would give a real bug.
This is where the reporting layer and the test-authoring layer are two different problems that get conflated. Automating delivery does nothing to reduce the rate of false failures a rotting suite produces; it just makes that noise arrive faster and more reliably. We built Autonoma to work on the other side of that equation: reducing false failures at the source rather than reporting on them faster. Our agents work directly from your codebase. The Planner agent reads your routes, components, and user flows to plan E2E test cases (including the database state each scenario needs), the Executor agent runs those cases against a live preview environment, and the Reviewer agent evaluates each result to separate a real bug from an agent error or a plan mismatch before it ever reaches your report. The Diffs Agent is the piece that matters most for this article specifically: on every PR, it reads the code diff and adds, updates, or deprecates test cases so the suite stays aligned with the application instead of drifting out of sync and generating brittle-locator failures.
To be direct about scope: Autonoma does not replace your JUnit reporter, your Allure setup, or the routing you build with the steps above. It is not a dashboard or a delivery mechanism. What it changes is the input to that pipeline, the actual pass or fail signal coming out of the E2E layer, so that when your automated report says red, it is more likely to mean the application broke rather than that a test rotted.
Automating the report does not fix the tests
The wiring in this article solves a delivery problem, not a quality problem. A reporter, an artifact, a routing step: none of that has any opinion about whether the underlying tests are worth trusting. That is a category error worth naming directly, because it is an easy one to make. Teams frequently treat "we have automated reporting now" as a testing maturity milestone, when what they actually built is a faster pipe for whatever signal, honest or not, the suite happens to produce.
If the suite behind the report is well maintained, automated reporting is a genuine win: failures reach the right people in seconds instead of the next morning, and nobody is manually assembling a summary before a release. If the suite is rotting, quietly accumulating brittle locators and stale fixtures, automating the report does not fix that. It automates the delivery of false reds, and it does so with more authority than a flaky test deserves, because now it shows up as a red X on the PR and a message in the team channel instead of something a tired engineer might have caught and dismissed manually.
The fix for that problem is not a better reporter. JUnit, Allure, and HTML reports are all capable of representing the truth accurately; they just repeat whatever they are given. The fix is reducing how often the underlying test run produces a false failure in the first place, whether that means a disciplined maintenance process for locators and fixtures, or a system like the Diffs Agent described above that regenerates test cases against the code as it changes. Wire the reporting first. It is the easier problem, and it is genuinely worth doing. Just do not mistake it for having solved the harder one.
FAQ
Configure your test runner to emit a structured report format such as JUnit XML or Allure, upload that report as a CI build artifact using an unconditional run step (so it uploads on both pass and fail), and add a routing step that parses the artifact and posts it to a PR comment, a Slack channel, or a dashboard. All three pieces (format, artifact, routing) need to be present for the process to count as automated rather than manual.
Have your test step write its output in JUnit XML format to a known path, such as test-results/junit.xml. Add an artifact-upload step immediately after it with an if: always() condition so it runs whether the tests passed or failed. Add a third step, also set to run unconditionally, using an action that reads that JUnit file and posts a summary as a PR comment or forwards it to another destination like Slack.
JUnit XML is a structured test-result format originally from the Java testing ecosystem that has become the de facto standard interchange format across most languages and CI platforms. It records each test case, its pass or fail status, duration, and failure message in a machine-readable structure. Nearly every CI platform, PR-comment action, and reporting dashboard can parse it, which is why it is the safest default even for test suites written in JavaScript, Python, or other non-Java languages.
Parse your test report artifact (typically JUnit XML or Allure output) at the end of the CI job, then send a formatted message to a Slack webhook with pass and fail counts, a link to the full report artifact, and the names of any failed tests. Trigger the webhook call on failure, or on every run if the team also wants confirmation of green builds. Keep the message short: a full stack trace dump in Slack gets ignored after the first few times.
Most CI platforms fail a job automatically when the test command exits with a non-zero status code, which is the default behavior of nearly every test runner when at least one test fails. The reporting and artifact-upload steps should still run even when this happens, which is why they need an unconditional run condition (such as if: always() in GitHub Actions) rather than the default success-only condition. Otherwise the build correctly fails, but you lose the report explaining why.


